


Top 10 Largest Economies in the World by GDP 2025: New Powers Rising [Latest Rankings]
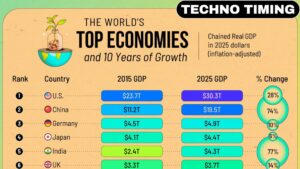
The largest economies in the world continue to shift in their rankings as we look ahead to 2025, with several notable changes reshaping the global economic landscape. The United States remains firmly in the top position with a projected GDP of $30.51 trillion, while China holds the second spot with $19.23 trillion. However, the gap between these economic giants is gradually narrowing as China’s growth rate of 3.95% outpaces the US’s 1.83%.
What’s particularly fascinating about the 2025 GDP rankings is India’s remarkable ascent. As the fastest-growing major economy with a growth rate of 6.20%, India is projected to overtake Japan and claim the fourth position globally with a nominal GDP of $4.19 trillion. Meanwhile, Germany has already secured its place as the third-largest economy with a projected GDP of $4.74 trillion. Furthermore, the overall global GDP is expected to reach an impressive $115.49 trillion, reflecting continued economic expansion despite various challenges.
In this comprehensive analysis, we’ll examine the top economies in the world for 2025, explore the factors driving these rankings, and understand the significance of nominal GDP in assessing economic power. Additionally, we’ll look at emerging economic forces, growth trends, and alternative measures like GDP per capita and purchasing power parity to provide a complete picture of the global economic hierarchy.
Global GDP Rankings 2025

Economic rankings offer a fascinating glimpse into the distribution of global wealth and power. At the heart of these rankings lies a crucial metric that economists, policymakers, and investors rely on to gauge economic strength: nominal GDP.
What is nominal GDP and why it matters
Nominal Gross Domestic Product represents the total market value of all goods and services produced within a country during a specific period at current market prices. Unlike real GDP, nominal GDP doesn’t adjust for inflation or deflation, which means it reflects both economic output and price changes.
In essence, nominal GDP serves as a fundamental measure of economic production that includes current prices in its calculation. All goods and services counted are valued at the prices they actually sold for that year. This makes nominal GDP particularly useful for several reasons:
- Economic Assessment: It provides a straightforward measure of economic growth, allowing stakeholders to track changes in the size and direction of the economy over time.
- Policy Formation: Governments and central banks rely on nominal GDP data to formulate and evaluate economic policies.
- International Comparisons: Nominal GDP enables analysts to assess relative economic size, productivity levels, and competitiveness across countries.
- Business Strategy: Companies use nominal GDP data to inform strategic planning, market analysis, and investment decisions.
One important distinction to note is that growing nominal GDP doesn’t necessarily indicate increased production. Since nominal GDP has a direct relationship with prices, when prices rise, nominal GDP follows—even if the quantity of goods and services remains unchanged.
Top 10 economies in the world 2025
According to the latest IMF projections as of July 2025, the ranking of the largest economies in the world has seen some notable shifts:
- United States: $30.51 trillion with 1.8% growth rate
- China: $19.23 trillion with 4.0% growth rate
- Germany: $4.74 trillion with -0.1% growth rate
- India: $4.19 trillion with 6.2% growth rate
- Japan: $4.19 trillion with 0.6% growth rate
- United Kingdom: $3.84 trillion with 1.1% growth rate
- France: $3.21 trillion with 0.6% growth rate
- Italy: $2.42 trillion with 0.4% growth rate
- Canada: $2.23 trillion with 1.4% growth rate
- Brazil: $2.13 trillion with 2.0% growth rate
Among these, the United States maintains a substantial lead over China by approximately $11.30 trillion. Nevertheless, this gap is gradually narrowing as China’s growth rate consistently outpaces that of the US.
The most significant change in this year’s rankings is India overtaking Japan to secure the fourth position. With a remarkable 6.2% growth rate—the highest among major economies—India has become a $4.19 trillion economy, marking a 105% increase in nominal GDP over the past decade.
Data sources: IMF, World Bank, UN
The GDP figures and economic projections cited come primarily from three authoritative sources:
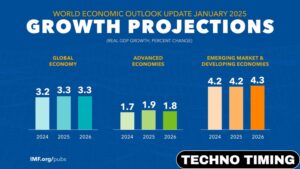
First and foremost, the International Monetary Fund (IMF) provides the most widely referenced GDP data. Their July 2025 World Economic Outlook projects global growth at 3.0% for 2025 and 3.1% for 2026. The IMF regularly updates economic forecasts based on changing market conditions, policy decisions, and global economic factors.
The World Bank offers complementary data and analysis. According to their June 2025 Global Economic Prospects report, global GDP growth is expected to average just 2.5% in the 2020s—the slowest pace of any decade since the 1960s.
Finally, the United Nations contributes additional economic data that helps create a more comprehensive picture of the global economy. Together, these three institutions provide the most reliable and consistent measurements of economic activity worldwide.
It’s worth noting that economic projections are subject to revision as new data becomes available and global conditions evolve. Consequently, the rankings presented here represent the most current snapshot based on available information as of July 2025.
New Powers Rising: Countries Climbing the GDP Ladder
Several nations are making remarkable strides in the global economic hierarchy, reshaping the list of the largest economies in the world for 2025. These emerging economic powers are redefining regional influence and challenging traditional economic strongholds.
India overtakes Japan
The most significant shift in this year’s nominal GDP rankings is India surpassing Japan to become the world’s fourth-largest economy. With a projected GDP of $4.19 trillion compared to Japan’s $4.19 trillion, India edges ahead by a slim margin of just $590 million. This remarkable achievement caps India’s extraordinary economic journey, having surged from the tenth largest economy in 2014 to the fourth position in just 11 years.
What makes India’s rise particularly impressive is its consistent growth rate of 6.2% for 2025, substantially outpacing Japan’s stagnant 0.6%. Moreover, India isn’t stopping there—it’s projected to overtake Germany within the next 2.5 to 3 years to claim the third spot globally. By 2028, India’s GDP is expected to reach approximately $5.58 trillion, firmly establishing its position among the elite economies.
Indonesia enters top 15
Alongside India, Indonesia is making significant economic strides, entering the top 15 largest economies globally. The Southeast Asian nation recorded a robust 4.9% growth in the first quarter of 2025, demonstrating resilience despite challenging global conditions. Notably, Indonesia’s economic trajectory could accelerate to 5.5% annually by 2027, driven by deregulation efforts, business environment improvements, and digital reforms.
Spain and Poland move up
Among European nations, Spain and Poland are ascending the GDP ranking ladder. Spain is projected to overtake Australia, South Korea, and Mexico in the rankings, reaching a GDP of approximately $1.80 trillion with a growth rate of 2.4%.
Simultaneously, Poland’s economy continues its impressive run as one of Europe’s fastest-growing economies. The country is set to overtake Switzerland in nominal GDP terms. Beyond 2025, Poland’s trajectory appears even more promising—by 2030, it’s projected to surpass developed economies like Israel, Spain, New Zealand, and Japan in terms of GDP per capita (PPP).
Countries losing ground in 2025
As some nations climb, others slide down the top economies in the world rankings. Mexico is projected to drop one position, while Iran faces a more substantial decline, losing six places in the global rankings. Japan, once the second-largest economy globally, continues its relative decline with minimal growth of 0.6% in both 2025 and 2026. Similarly, Germany is projected to see no GDP growth in 2025, potentially leaving it vulnerable to being overtaken by India in coming years.
GDP Growth Trends and Economic Momentum
Beyond the shifts in GDP rankings, global economic growth is displaying stark contrasts in 2025, with developing nations surging ahead as traditional powerhouses struggle to maintain momentum.
Fastest growing economies in 2025
African and Asian nations dominate the list of fastest-expanding economies this year. According to IMF projections, South Sudan leads globally with an extraordinary 27.2% growth rate, driven primarily by recovery in its oil sector. Guyana follows with 14.4% growth, fueled by its offshore oil discoveries since 2015 and subsequent production boom. Libya ranks third at 13.7%, also benefiting from oil production recovery.
Other standout performers include:
- Senegal (9.3%), Palau (8.5%), and Sudan (8.3%)
- Uganda (7.5%), Niger (7.3%), and Macao SAR (7.3%)
- Mongolia (7.0%) and Zambia (6.6%)
Interestingly, 12 of the 20 fastest-growing economies are located in Africa, with 6 in Asia, highlighting these regions’ emerging economic dynamism.
Slowing giants: US, Germany, Japan
In contrast, traditional economic powerhouses are experiencing significant deceleration. Germany’s economy contracted by 0.3% in the second quarter of 2025, making it the only G7 member that failed to grow for the last two years. This slowdown stems partly from weakened industrial production and decreased investment, which fell 1.4%.
Likewise, Japan’s economy shrank by 0.2% in the first quarter, its first quarterly contraction since early 2024. Japan faces structural challenges from an aging population that increases welfare spending while limiting labor and demand.
The United States, although still growing, is projected to see GDP growth decline from 2.8% in 2024 to 1.6% in 2025 and 1.5% in 2026. This represents a significant cooling of what was previously the most resilient major economy.
Impact of inflation and currency shifts
Although global headline inflation is gradually retreating, progress remains uneven. The IMF projects global inflation to fall from 4.5% in 2024 to 3.6% in 2025, yet this improvement is vulnerable to commodity shocks, trade frictions, and foreign exchange volatility.
Indeed, inflationary pressures have resurfaced in some economies, partly due to higher trade costs in countries raising tariffs. Currency appreciation in regions like the EU is amplifying disinflationary pressures on imported commodities and goods, creating divergent inflation paths across major economies.
Beyond Size: GDP Per Capita and Living Standards

While total GDP highlights a nation’s economic might, GDP per capita offers a crucial lens into individual prosperity and living standards. This metric, calculated by dividing a country’s GDP by its population, reveals aspects of economic health that raw GDP figures often mask.
Top countries by GDP per capita
In 2025, Luxembourg tops the global GDP per capita rankings at USD 140,941, followed by Ireland (USD 108,919) and Switzerland (USD 104,896). Singapore (USD 92,932) and Iceland (USD 90,284) round out the top five. Interestingly, the United States ranks seventh at USD 89,105, yet remains the only country in the top 10 with a population exceeding 10 million. When measured by purchasing power parity (PPP), Singapore leads at Int. USD 156,755, followed closely by Luxembourg at Int. USD 152,915.
Why GDP per capita matters
GDP per capita serves as a critical indicator of economic performance and well-being. First, it enables meaningful cross-country comparisons of average living standards. Higher figures typically suggest greater access to goods, services, healthcare, and education. Second, it helps governments allocate resources effectively and formulate targeted economic policies. For businesses, this metric offers valuable insights for international expansion, identifying affluent markets ideal for luxury goods or high-end services.
Disparities between total GDP and per capita
Total GDP and per capita figures often tell dramatically different stories. For instance, China ranks as the world’s second-largest economy by total GDP but falls significantly lower in per capita terms. Conversely, many smaller nations with specialized economies—particularly financial hubs like Luxembourg, Singapore, and Switzerland—dominate per capita rankings despite modest total GDP. These disparities highlight that economic size alone doesn’t guarantee individual prosperity. Additionally, tax haven distortions can significantly inflate GDP figures in countries like Ireland, where corporate tax advantages have prompted the government to develop alternative economic metrics.
Nominal GDP vs PPP: Understanding the Difference
Understanding different methods of measuring economic output provides crucial context when analyzing the largest economies in the world. Beyond the nominal GDP figures we’ve examined so far, another key metric offers an alternative perspective.
What is purchasing power parity (PPP)?
Purchasing power parity (PPP) is an exchange rate that equalizes the purchasing power of different currencies by eliminating price level differences between countries. Essentially, PPP measures how many units of Country A’s currency are needed to buy the same amount of goods and services in Country B. For instance, if a hamburger costs £2 in London and $4 in New York, the PPP exchange rate would be 1 pound to 2 US dollars.
Top economies by PPP in 2025
The global economic hierarchy looks remarkably different through the PPP lens:
- China: $40,716.45 billion (19.7% of global share)
- United States: $30,507.22 billion (14.7%)
- India: $17,647.05 billion (8.53%)
- Russia: $7,191.72 billion (3.48%)
- Japan: $6,741.19 billion (3.26%)
Interestingly, on a PPP basis, China surpasses the US by approximately $10.2 trillion, whereas in nominal terms, the US leads China by $11.3 trillion.
When to use nominal GDP vs PPP
Nominal GDP proves more appropriate for financial flows and international trade analyses. By contrast, PPP better reflects overall well-being and living standards, as it accounts for non-traded goods that are typically cheaper in developing nations. Furthermore, PPP rates remain relatively stable compared to market exchange rates, which fluctuate based on speculative activities and short-term market conditions.
Conclusion
The world economy continues to evolve rapidly as we approach 2025, with established powers and emerging nations reshaping the global economic landscape. Undoubtedly, the United States maintains its dominant position with a substantial lead over China, though this gap gradually narrows as China’s growth rate consistently outpaces American expansion. Meanwhile, India stands as perhaps the most compelling success story, leapfrogging Japan to claim the fourth position globally—a remarkable achievement highlighting the shifting center of economic gravity toward Asia.
Traditional economic powerhouses face significant challenges ahead. Germany shows concerning stagnation with negative growth, while Japan struggles with minimal expansion due to structural demographic issues. Consequently, these established economies risk further slippage in global rankings as more dynamic nations surge forward.
The contrast between developed and developing economies becomes particularly striking when examining growth trajectories. African and Asian nations dominate the fastest-growing economies list, with countries like South Sudan, Guyana, and Libya achieving double-digit expansion rates. Conversely, major Western economies project modest or declining growth figures, signaling a potential long-term realignment of global economic influence.
Beyond raw economic size, GDP per capita figures reveal a different picture of prosperity. Luxembourg, Ireland, and Switzerland lead these rankings, demonstrating that smaller nations often provide higher living standards than economic giants. This disparity between total GDP and per capita metrics reminds us that economic power alone doesn’t guarantee individual prosperity.
Additionally, purchasing power parity offers an alternative lens for economic comparison. Through PPP calculations, China already surpasses the United States by approximately $10.2 trillion, while India claims a much larger share of global economic activity than nominal figures suggest.
The economic landscape of 2025 therefore represents a world in transition—one where established patterns of dominance face increasing challenges from rising powers. These shifts will likely accelerate in coming years as demographic trends, technological innovation, and changing trade patterns continue reshaping our global economic order.
Key Takeaways
The global economic landscape is experiencing a dramatic shift in 2025, with emerging powers challenging traditional economic hierarchies and reshaping international influence.
- India overtakes Japan to become the world’s 4th largest economy with $4.19 trillion GDP and 6.2% growth rate, marking its rise from 10th position in just 11 years.
- Developing nations dominate growth with African and Asian countries leading expansion rates—South Sudan (27.2%), Guyana (14.4%), and Libya (13.7%) top the fastest-growing economies list.
- Traditional powerhouses struggle as Germany contracts (-0.1%), Japan stagnates (0.6%), and the US slows to 1.8% growth, signaling a potential long-term realignment of global economic influence.
- GDP per capita reveals different winners with Luxembourg ($140,941), Ireland ($108,919), and Switzerland ($104,896) leading prosperity rankings despite smaller total economies.
- China leads in purchasing power parity with $40.7 trillion compared to the US’s $30.5 trillion, demonstrating how different metrics can dramatically alter economic hierarchies.
This economic transformation reflects a world where demographic trends, technological innovation, and changing trade patterns are accelerating the shift from Western-dominated to multipolar global economic power.
Also Read: 10 Tips for Maintaining a Healthy Lifestyle and Body Weight